Neurographic specimens
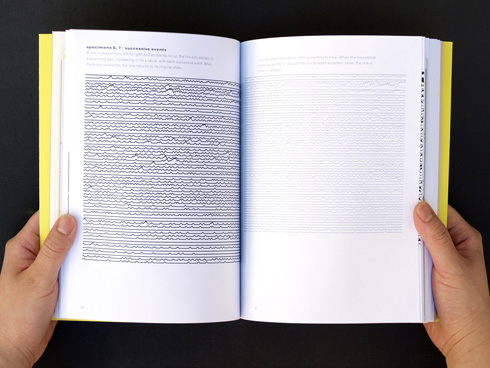
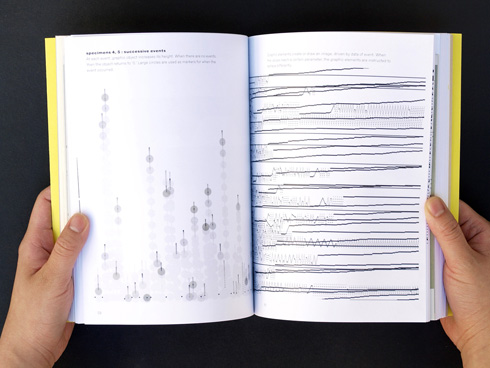
Neurographic specimens in this chapter were developed as a graphical means of exploring and analyzing a specific type of neural data, spike trains. The term 'specimens' is borrowed from a commonly used resource by designers, typographic specimens; where collections of typefaces are displayed to show letters, numerals, and punctuation at different sizes, widths and lengths. Designers use this resource to get an idea of what typeface would best function to communicate text. In the same manner, neurographic specimens are programmed designs that could be viewed as a 'typeface' for neurodata. Certain specimens accentuate different attributes of data. Three characteristics of neural data were used to develop neurographic specimens: event, successive events, and refractory periods. These characteristics were used to create alternate perspectives of the same set of data.
Neural spike trains & analysis
Neurons are cells from the nervous system. Neurons emit electric pulsed signals that are thought to be carriers of information. For the purposes of analysis, the signals are translated into binary waveforms, which are referred to as spike trains. Neuroscientists study spike trains as a way to look for patterns or relationships to better understand some aspect of neural functioning.
Neurons can signal at a certain electrical strength by rate, by the variance in the rate, and by a skew in the rate. When two neurons emit signals at the same relative time, this might signal intensity or causality. The order of occurrence can also indicate of neural behavior on a biological level. There are a variety of techniques that allow scientists to gather this type of data that includes inserting nanometric electrodes into brain tissue that may be from sliced samples to real-time collection from live subjects.
Spike train analysis includes relating neural activity to stimulation and identifying patterns. How data is analyzed varies from scientist to scientist. All scientists who study neurodata have access to data analysis software. Many are able to program their own tools, using programs such as MatLab. However, these programs, as powerful as they are, offer limited visual variety in suggesting how data may be visualized. Some scientists listen to the neurodata as a method of scanning data, while others feed data through various plotting programs to see if a pattern will emerge.
The growing problem that neuroscientists face is being able to visually filter through large volumes of neural data. In addition, at the stage of analysis and exploration, scientists do not necessarily know what patterns might be relevant or the hierarchy of the data to be applied. With programming platforms, such as Processing, designers have the opportunity to meet the needs of scientists to have new visual grounds to interface and engage with data. What Processing supplies is the ability for data to have a direct, utilitarian relationship to the ed form.
Exploratory data analysis
Underlying the specimens is the notion of Exploratory Data Analysis. Exploratory Data Analysis is the philosophy that data visualized can reveal its underlying structure and model. This differ from Classical approaches to data, where a model is determined and then data is collected. EDA asserts that the model, and in essence the hypothesis, can be reveled by data. EDA relies heavily on graphics to represent the data and programming platforms. The reason for the heavy reliance on graphics is that by its very nature the main role of EDA is to open-mindedly explore, and graphics gives the analysts unparalleled power to do so, enticing the data to reveal its structural secrets, and being always ready to gain some new, often unsuspected, insight into the data. In combination with the natural pattern-recognition capabilities that we all possess, graphics provides unparalleled power to carry this out. A common visual analysis used is the scatter plot technique.
The premise of exploratory data analysis is the ideal grounds from which design could contribute greatly, however currently, there are no visual models that demonstrate the potential or promise of what is possible.
Design Questions
What are ways in which large amounts of data can be displayed comprehensibly? How does data perform?
What qualities work better in exhibiting the whole, ver-
sus lesser amounts?
Morphological grid
Neurographic specimens was a very challenging design problem. Particular to its content was data. In Computer Graphics as Allegorical Knowledge: Electronic Imagery in the Sciences, Richard Wright describes data collection as such: “The drive towards a totality of understanding or ‘finality’ in scientific research has resulted in the desire to acquire immense amounts of information about a phenomenon to ensure certitude and has led to what has become known as the ‘firehose of data’ effect.“ [8] Increasing the difficulty was uncertainty in knowing what the data meant. How does one design when the value of its content has yet to be determined? How does one design when design is utilized as the vehicle for exploration and analysis? An additional challenge was in realizing that in Processing or programming, the solutions are infinite. Any shape or behavior could be programmed to data. The design solution seemed to be only a matter of application. In his essay, Design and the Play Instinct, Paul Rand wrote ”I believe that if, in the statement of a problem, undue emphasis is placed on freedom and self-expression, the result is apt to be...a meaningless solution.” [9] Working on the neurographic specimens project, this very problem was amplified where on one hand, the project demanded total freedom from what was conventional. I needed to explore, experiment, and invent design in perhaps the most self-expressive ways. Yet on the other hand, the freedom was daunting and the possibilities were overwhelming. In other words, a great volume of visually enticing work could be created that would amount to the equivalent of additional noise. Keeping Rand in mind, the approach to developing neurographic specimens was to place less emphasis on the visual experiments alone and to give more attention to how the visuals could combine with the nature of the problem, specifically, what are different ways inherent patterns in data be explored and revealed.
In conversation with Lou Danziger, he suggested a method for working through this type of problem that Karl Gerstner explained first in his book, Designing Programmes. A grid was employed as an organizing system where main categories are listed on one column and the following columns would entail attributes. The criteria could be rough, knowing that they would be refined as one works through the grid. Karl Gerstner cites Fritz Zwicky has having been the first person to suggest this method of problem solving, although Zwicky intended it for scientists rather than designers. [10]
Neurographic specimens were developed using a morphological grid, which was first developed by Fritz Zwicky and introduced to the author by graphic designer, Louis Danziger. Similar to typography specimens, neurographic specimens have differing ‘faces’ that may enhance a particular feature of the data. Similar to typography specimens, neurographic specimens have ‘faces’ that may enhance a particular feature of the data. Whether used to visualize a single neuron or multiple neurons, neurographic specimens are displayed to graphically express data over a period of time. Dynamic specimens are available for view online at neurographica.org
There are areas for further development, namely in interaction, which demands a greater amount of attention and development outside of the current project time frame. Providing analysts the capability to interface with the data would add a new level of analysis that have yet to be fully explored.
(click on image below to view more from the specimens collection)